Earnings Chop Amidst Geopolitical Heat
By Fauzia Timberlake,
personal coach for trading options
August 3, 2026
Week in Review
The final week of July delivered a high-stakes tug-of-war across global asset classes, defined by intense corporate earnings digestions, aggressive sector rotation, and shifting macroeconomic currents. Equities faced a choppy backdrop as investors weighed blockbuster mega-cap scorecards against cautious forward guidance. While traditional blue chips and defensive segments displayed notable resilience—keeping the Dow near flat—high-multiple technology and growth components bore the brunt of institutional profit-taking, dragging the Nasdaq and Russell benchmarks lower.
Fixed income markets experienced steady downward pressure across the curve, driving sovereign yields higher as resilient consumer data and post-FOMC monetary policy commentary forced participants to re-evaluate the pace of future easing.
This upward drift in yields, coupled with lingering inflation sensitivities, cast a shadow over non-yielding assets. Consequently, gold pulled back from recent heights as a firmer dollar and rising real yields prompted a brief cooling-off period for the precious metal.
In the commodities complex, crude oil carved out an entirely different trajectory, staging a powerful rally to finish the week higher on the back of tightening supply expectations and shifting geopolitical risk premiums.
Digital assets mirrored the broader risk-off tone in high-beta sectors, with bitcoin futures drifting lower as traders consolidated positions and waited for a definitive macro catalyst to break the prevailing summer range.
Strategy Corner
Based on this week's market movements, here are some trading ideas and option strategies for the readers' consideration. The positions can be scaled bigger (or smaller) to suit individual account size.
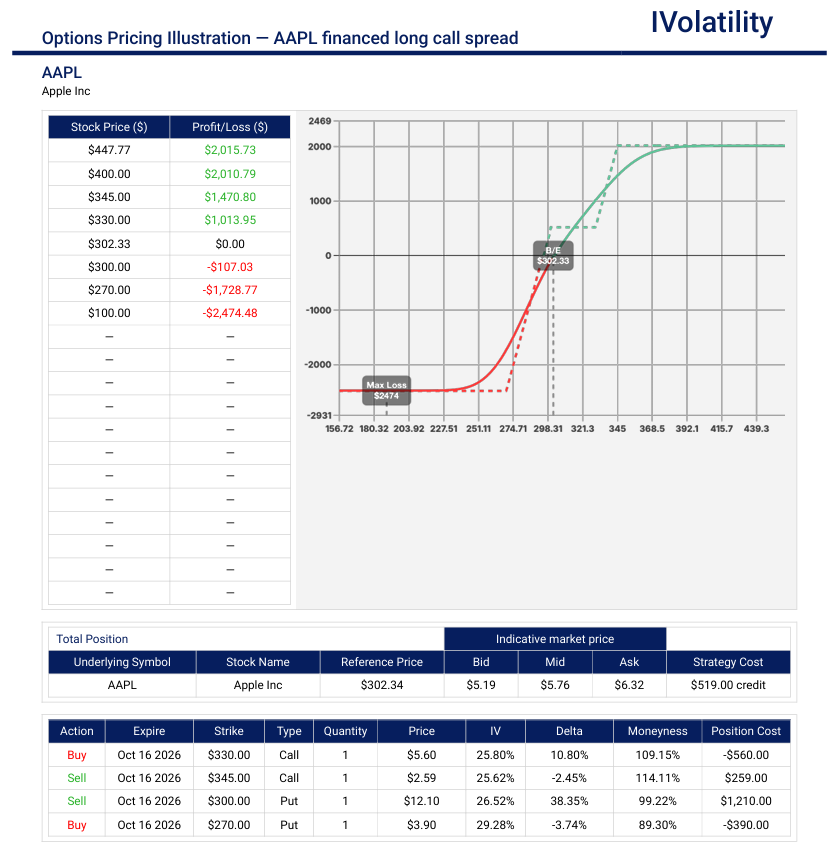
AAPL (closed at 309.03 on Friday, July 31st)
Supporting a bullish stance on AAPL right after a post-earnings sell-off relies on separating headline knee-jerk reactions from structural value creation. If a trader believes that the recent sell-off was guidance-driven, not results-driven, a tactical "buy-the-dip" window can be seen.
Outlook: bullish
Strategy: Bullish Risk Reversal
In the Oct monthly expiration, BUY an OTM call spread and finance it with the sale of an OTM put spread, all for a net credit. This could be considered a capital-efficient bullish structuring.
Credit collected about $500 for buying the 330/345 call spread and selling the 270/300 put spread
Buying power required about $2600
Downside breakeven around 295
Max potential value could be in excess of $3000
ENPH (closed at 37.51 on Friday, July 31st)
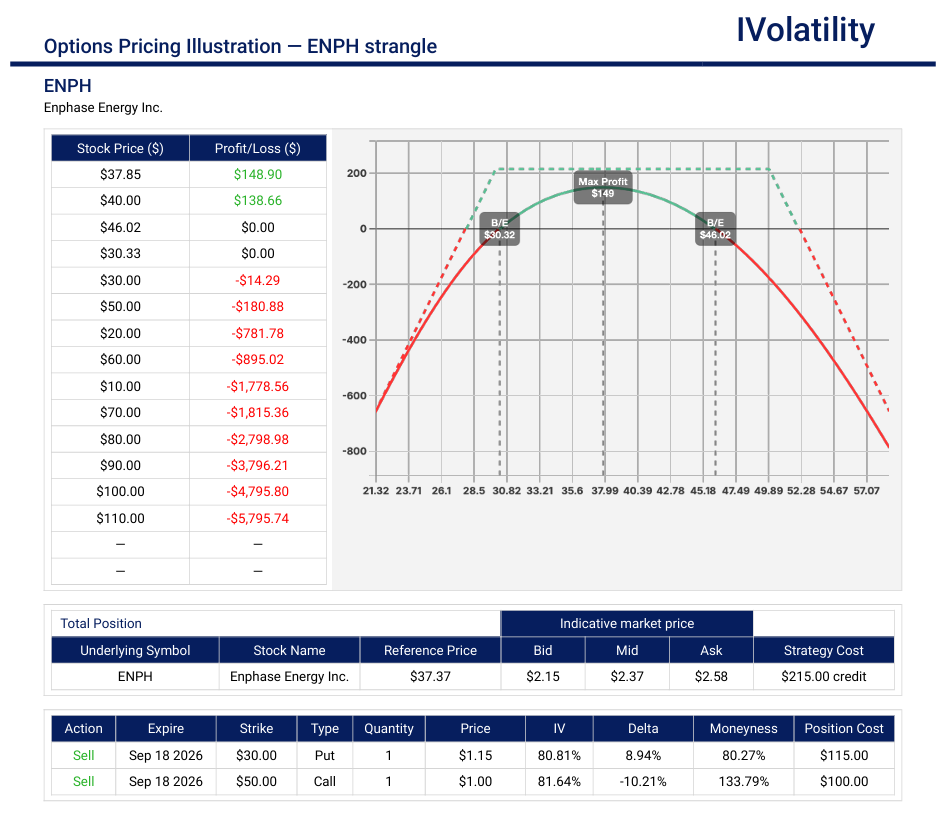
Implementing a neutral position for the September expiration cycle allows options sellers to capitalize on this post-earnings environment. By selling an out-of-the-money (OTM) call and an OTM put outside the expected move in Sept, the strategy aims to absorb high option premiums and profit from time decay (theta) as the stock settles into a range-bound channel.
Outlook: neutral
Strategy: short strangle
In the Sept monthly expiration, sell the 30/50 strangle
Premium collected about $240 / contract
Probability of profit around 69%
Breakevens around 28 and 52
Movement of the Major Market Indices:
| INDEX | UP | DOWN |
| SPY | 0.34% | |
| QQQ | -0.49% | |
| IWM | -0.95% | |
| DIA | 0.06% | |
| GLD | -1.16% | |
| BTC/USD | -1.10% | |
| 10-year yield | 1.94% | |
| Crude Oil | -1.76% | |
| VIX | -9.19% |
Movement of the Major Market Sectors:
| SECTOR | UP | DOWN |
| TECH (XLK) | -1.39% | |
| FINANCIALS (XL) | 0.32% | |
| INDUSTRIALS (XLI) | 0.93% | |
| ENERGY XLE | 1.95% | |
| HEALTHCARE (XLV) | -0.28% | |
| UTILITIES (XLU) | -3.86% | |
| MATERIALS (XLB) | -2.02% | |
| REAL ESTATE (XLRE) | -1.72% | |
| CONSUMER STAPLES (XLP) | 0.75% | |
| CONSUMER DISCRETIONARY (XLY) | 4.71% |
Notable Gainers Week of July 27th – July 31st
The notable gainers for the week reflected a stark divergence across market caps, balancing powerful momentum in specialized infrastructure and semiconductor substrate plays alongside a late-week recovery surge in mega-cap tech leadership. While cyclical industrials and material suppliers captured aggressive upside, large-cap growth benefited from broad-based portfolio rebalancing flows as desks positioned for upcoming corporate scorecards.
- Amazon.com Inc. (AMZN): Advanced 15.3% as strong institutional buying and robust end-of-month portfolio rebalancing flows lifted major mega-cap tech leadership following mid-week volatility.
- IES Holdings Inc. (IESC): Surged 30.3% following powerful momentum across specialized industrial infrastructure and electrical contracting demand.
- Integer Holdings Corp. (ITGR): Climbed 20.2% on the back of positive sector sentiment and strong specialized manufacturing demand within medical technology.
- AXT Inc. (AXTI): Rallied 28.7% as renewed interest in advanced semiconductor substrate materials and specialty wafer manufacturing caught aggressive dip-buying interest.
Notable Losers Week of July 27th – July 31st
The notable losers for the week were heavily concentrated among high-multiple growth names, consumer interactive platforms, and specialized industrial firms facing sharp profit-taking and valuation compression. While broader markets attempted a late-week recovery, these equities experienced steep pullbacks as institutional investors aggressively reallocated capital away from extended segments.
- Roblox Corporation (RBLX): Fell 25.1% amid intense selling pressure across interactive entertainment and high-multiple consumer discretionary growth equities.
- Alnylam Pharmaceuticals Inc. (ALNY): Dropped 24.4% as profit-taking hit leading biotechnology components following recent periods of outperformance.
- Lennox International Inc. (LII): Slumped 23.2% under the weight of softer sector sentiment and cautious institutional positioning regarding capital goods.
- The Western Union Company (WU): Declined 22.6% following downward revisions in investor sentiment toward traditional transaction and financial processing networks.
- MasTec Inc. (MTZ): Pulled back 22.1% as strong preceding run-ups in infrastructure engineering and construction names invited broad profit-taking.
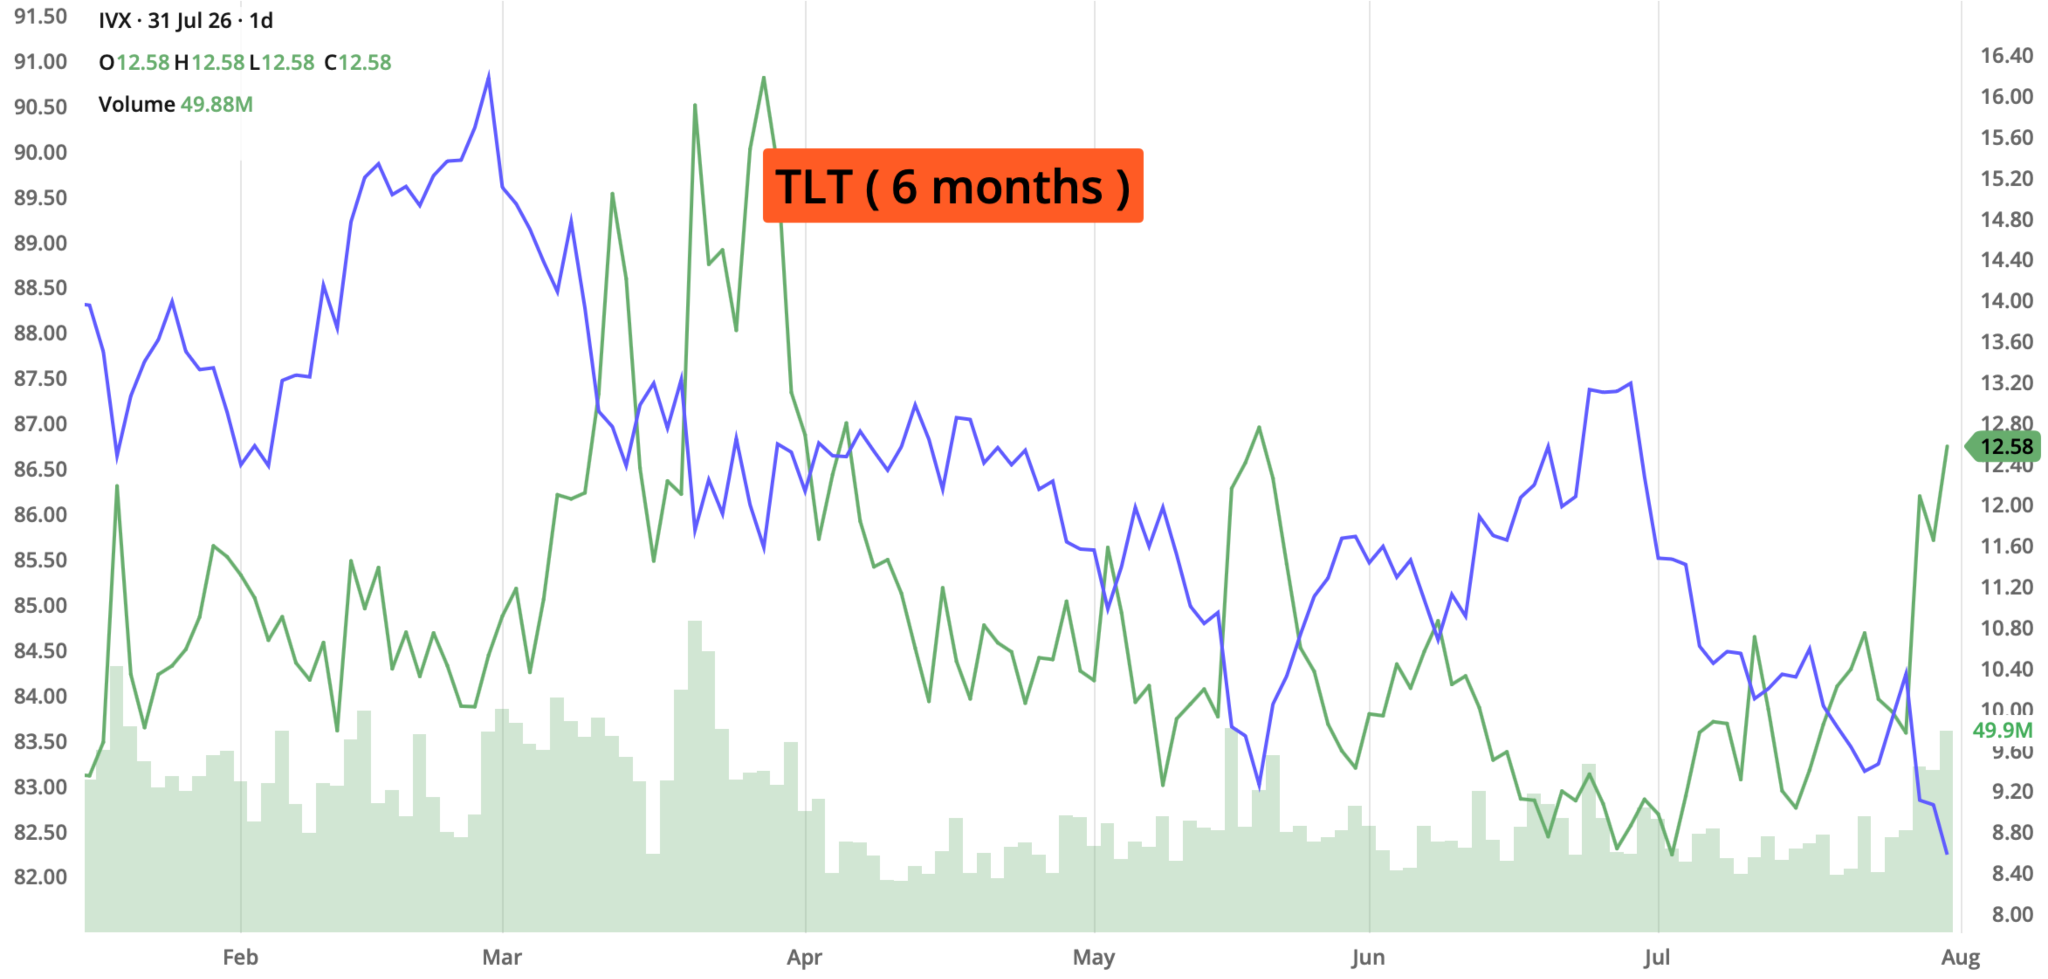
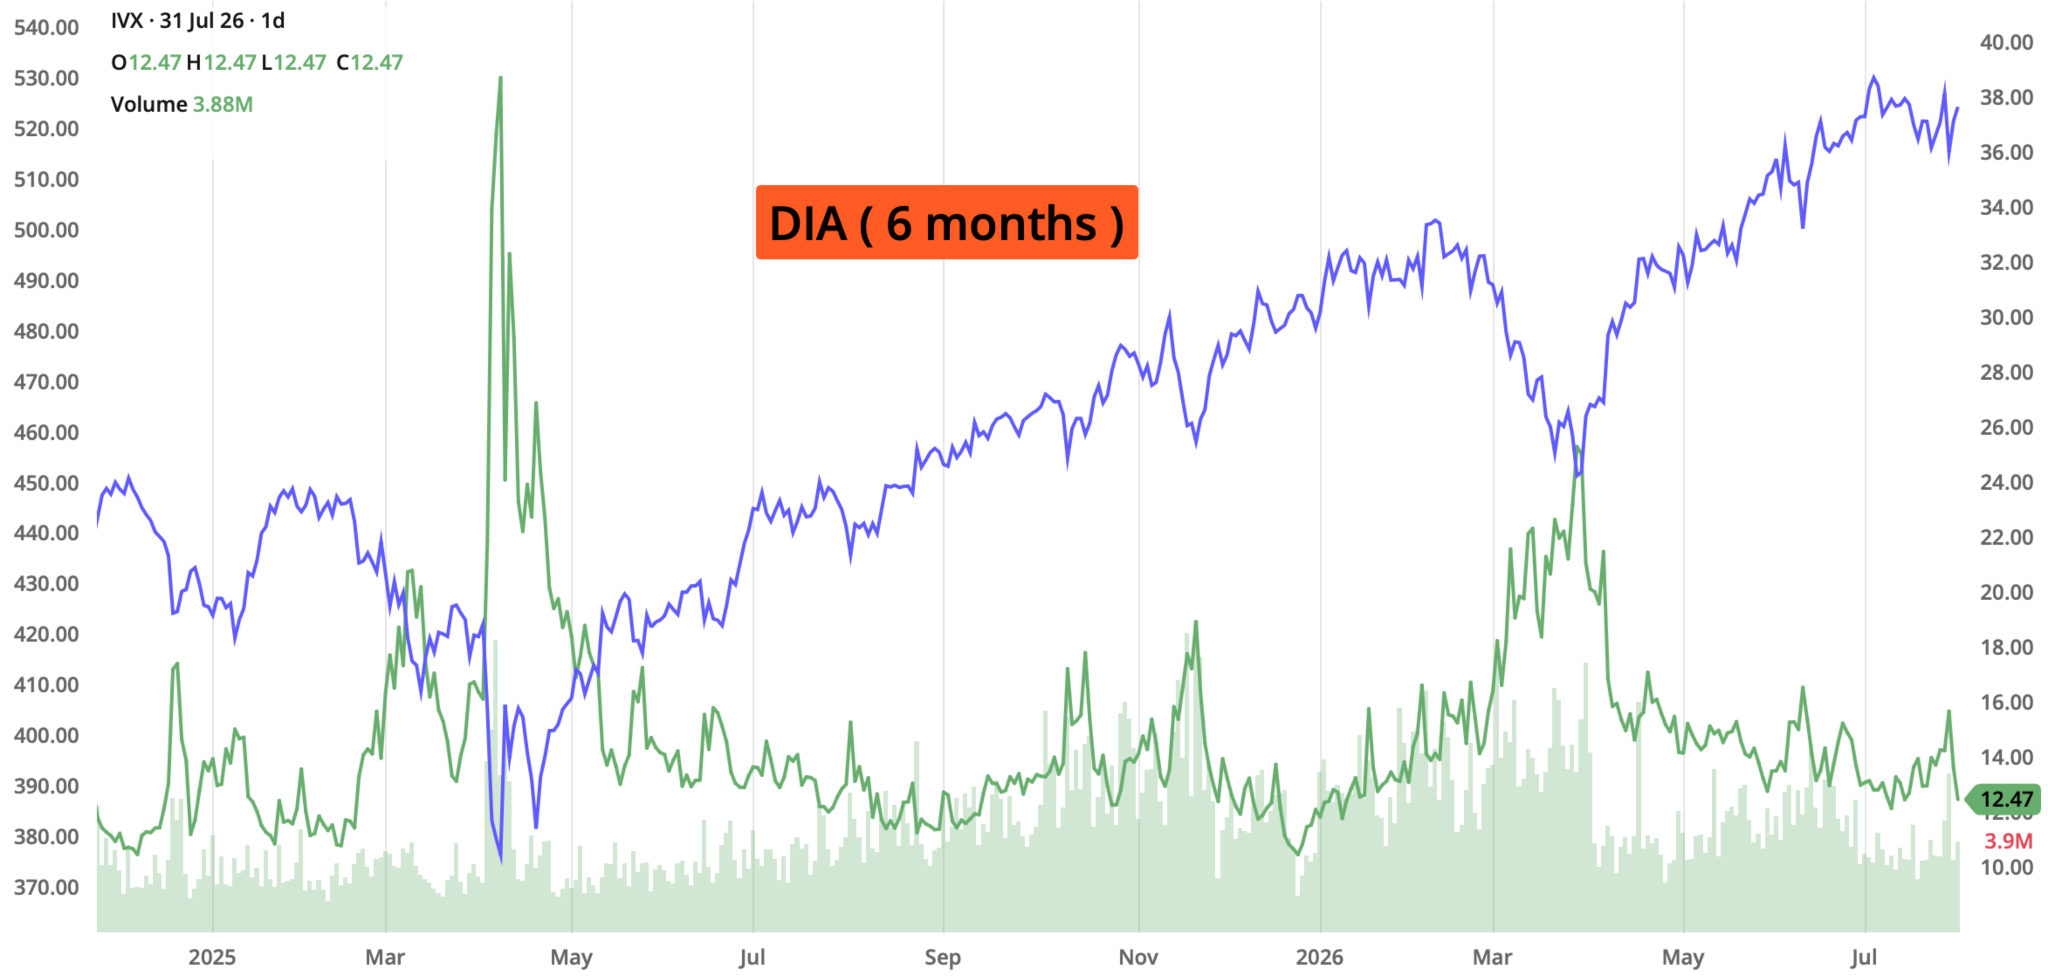
Review selected market indices below:
Daily Notable Market Action
Market Summary for Monday, July 27th
Equity markets navigated a mixed and hesitant session as investors reacted to a sharp relief in crude oil prices following an easing of geopolitical friction in the Middle East. Energy markets commanded intense focus on the downside as oil tumbled over 8%, pulling back from recent spikes and alleviating immediate inflation pressures across the broader tape.
At the same time, tech and semiconductor segments faced renewed selling pressure—exacerbated by developments surrounding hardware production in Asia—causing the Nasdaq to lag. Meanwhile, blue-chip components found a footing, allowing the Dow and S&P 500 to snap consecutive losing streaks as trading desks balanced easing commodity costs against looming mega-cap tech earnings and upcoming Federal Reserve guidance.
Fixed-income markets saw relief alongside falling energy prices, helping ease duration pressures on high-multiple growth equities even as overarching sector rotation kept broad conviction subdued.
- S&P 500: 7,413.18 (+0.02%)
- Nasdaq Composite: 24,932.08 (-0.18%)
Market Summary for Tuesday, July 28th
Equity markets experienced a sharp rotation as heavy selling in semiconductor and AI-linked hardware stocks weighed heavily on the technology sector, while strong earnings reports from industrial and consumer bellwethers lifted the broader market. While global tech sentiment remained fragile—prompted by steep pullbacks in overseas chipmakers—blue-chip components rallied firmly, carrying the Dow and S&P 500 into positive territory.
Concurrently, energy markets continued to experience downward relief as crude oil prices extended their retreat, easing overarching inflation concerns ahead of the Federal Reserve's highly anticipated monetary policy decision. Trading desks remained relatively defensive on high-multiple growth names, opting instead to bid up value and non-tech sectors as market participants weighed upcoming mega-cap earnings reports.
Fixed-income markets saw continued relief alongside sliding commodity costs, pulling Treasury yields lower and providing subtle valuation support to broader equity indexes.
- S&P 500: 7,428.78 (+0.21%)
- Nasdaq Composite: 24,876.91 (-0.22%)
Market Summary for Wednesday, July 29th
Equity markets suffered a sharp and broad-based sell-off as a renewed wave of weakness in AI-linked hardware and semiconductor components dragged Wall Street lower. Sentiment took a hit after major international chip results fell short of lofty expectations, compounding lingering skepticism surrounding the sustainability of massive tech infrastructure spending.
Compounding the defensive tone, the Federal Reserve opted to hold interest rates unchanged, while oil prices rebounded sharply from earlier weekly lows to inject fresh inflation anxieties back into the tape. Trading desks grew increasingly risk-off ahead of upcoming mega-cap tech earnings reports, sending major indices tumbling into a steep afternoon retreat.
Fixed-income markets experienced renewed volatility alongside fluctuating commodity prices and monetary policy uncertainty, keeping duration headwinds active across growth-heavy sectors.
- S&P 500: 7,316.15 (-1.52%)
- Nasdaq Composite: 24,442.94 (-1.74%)
Market Summary for Thursday, July 30th
Equity markets rebounded aggressively as a powerful wave of dip-buying swept across Wall Street, lifting major indices sharply higher following the previous session's steep losses. Technology and semiconductor heavyweights recaptured strong leadership, staging a decisive comeback that propelled the Nasdaq to lead the broader market recovery as investors reassessed valuations ahead of critical mega-cap earnings reports.
Safe-haven assets and commodity markets stabilized as trading desks embraced a renewed risk-on appetite, helping ease the defensive posture that had dominated earlier in the week. Market participants welcomed the stabilization in risk sentiment, allowing cyclical and growth sectors alike to absorb the prior day's shock and power a broad-based advance.
Fixed-income markets experienced calm as Treasury yields consolidated near recent ranges, removing immediate duration friction and granting high-multiple equities room to rally.
- S&P 500: 7,437.63 (+1.66%)
- Nasdaq Composite: 24,942.18 (+2.04%)
Market Summary for Friday, July 31st
Equity markets finished the week on a firm upward trajectory, extending their recovery as strong corporate earnings and steady buying in mega-cap technology names anchored investor confidence. Trading desks displayed growing risk appetite heading into the weekend, allowing major indices to secure solid gains and successfully cap off a volatile week on a positive note.
Broader macroeconomic data releases and stable commodity prices provided a calm backdrop, helping alleviate lingering inflation anxieties and keeping volatility well contained. Market participants absorbed end-of-month portfolio rebalancing flows smoothly, supporting broad sector participation as indices closed near session highs.
Fixed-income markets remained relatively range-bound as Treasury yields held steady, removing duration headwinds and providing a supportive environment for equity valuations.
- S&P 500: 7,489.72 (+0.70%)
- Nasdaq Composite: 25,373.85 (+1.00%)
Notable Earnings: Aug 3rd – Aug 7th
As the peak of Q2 earnings season rolls into early August, attention shifts from mega-cap tech giants toward pivotal enterprise software, semiconductor infrastructure, and foundational industrial bellwethers. Forward guidance for concrete signs of sustainable enterprise demand and infrastructure return on investment may be the main focus for investors.
The actual earnings date may vary, so traders should confirm with their brokers. If a trader wishes to open a position to participate in earnings announcements, it is important to check whether the earnings are released BEFORE the markets open or AFTER the markets close on the date of earnings.
Monday, Aug 3rd: ON / PLTR / TSN / WMB
Tuesday, Aug 4th: AMD / AMGN / ANET / CAT / MRK / PFE / SPOT / T / SPCX
Wednesday, Aug 5th: APP / COP / CVS / DIS / HOOD / IONQ / LLY / SHOP / SNDK / UBER / WDC
Thursday, Aug 6th: BALL / COP / QBTS / WBD
Friday, Aug 7th: KMB / UA
Economic Calendar: Aug 3rd – Aug 7th
The economic calendar for the week of August 3rd through August 7th shifts its primary focus toward labor market health, headlined by the crucial July Employment Report on Friday. The week also features key sentiment readings from the manufacturing and services sectors, updates on job openings and labor turnover, and mid-week productivity and trade balance data.
Monday, Aug 3rd
ISM Manufacturing PMI (July): Measures business sentiment, new orders, and production activity across the U.S. manufacturing sector as a key indicator of industrial momentum.
Construction Spending (June): Tracks the monthly changes in total public and private construction outlays across residential and non-residential projects.
Tuesday, Aug 4th
US International Trade Balance (June): Measures the net gap between U.S. exports and imports of goods and services, offering insight into global trade dynamics.
JOLTS Job Openings (June): Details the monthly level of open jobs, quits, and layoffs, providing a granular look at labor demand tightness.
Factory Orders (June): Tracks total monthly orders for manufactured goods, split to gauge ongoing capital goods and business investment trends.
Wednesday, Aug 5th
ADP Employment Report (July): Provides an independent early indicator of private-sector job creation ahead of the official government labor figures.
ISM Services PMI (July): Measures business activity, employment, and new orders across the dominant service sector of the economy.
Thursday, Aug 6th
Nonfarm Productivity & Costs (Q2 Preliminary): Measures worker output per hour and labor compensation trends, serving as a vital gauge of inflation pressures stemming from productivity.
US Wholesale Inventories (June Final): Finalized reading tracking inventory accumulation across wholesale channels relative to current sales pace.
Friday, Aug 7th
US Employment Report / Nonfarm Payrolls (July): The definitive headline release of the week, detailing net job creation, the unemployment rate, and average hourly earnings growth.
Consumer Credit (June): Tracks changes in consumer borrowing levels via credit cards, auto loans, and revolving debt to gauge household leverage and spending capacity.
Blue Sky Horizons
The Algorithmic Edge – How AI may be Reshaping Market Mechanics and Risk (part 2)
Building directly upon last week's exploration of how AI may be reshaping Market Mechanics and Risk, the discussion can be significantly deepened by focusing on how modern AI architectures are moving from passive analytics to active market mediation, and the unique systemic vulnerabilities that come with it.
Here are three compelling angles that can be woven here:
- From Information Processing to Direct Market Mediation
- The Shift: Traditional algorithmic trading focused on speed and executing static rules (e.g., trend following, arbitrage). Today, advanced multimodal neural networks and large-scale semantic models are shifting from supporting investment decisions to mediating them directly.
- The Market Consequence: By processing unstructured text, alternative data, and complex order-book dynamics simultaneously, AI models are drastically shortening arbitrage windows. This fundamentally alters traditional information discovery, shifting the competitive edge away from human-led research and toward model design, data governance, and proprietary system infrastructure.
- The Danger of Algorithmic Herding and Nonlinear Correlations
- The Core Risk: When institutional participants deploy similar classes of predictive AI models (such as sentiment-driven reinforcement learning or Hidden Markov regime-clustering models), they risk creating a new brand of algorithmic herding.
- The Market Consequence: Standard econometric models rely on historical relationships that assume linear or normal distributions of returns. Advanced AI, by contrast, identifies complex, nonlinear correlations. When market stress hits, these models can simultaneously trigger sudden, synchronized capital rotation or deleveraging, accelerating intraday volatility spikes (as witnessed during recent sudden sector repricing events) and challenging traditional liquidity safety nets.
- The New Paradigm of Stress Prediction and Microstructure Resilience
- The Opportunity: On the flip side, regulators and sophisticated risk desks are increasingly adopting machine learning tools—such as random forest distributions and recurrent neural networks—to forecast financial stress and market dysfunction in real time.
- The Market Consequence: As the ecosystem evolves, the ability to monitor emerging liquidity gaps and hidden leverage before they cascade through interconnected intermediaries will define the next generation of institutional risk management. For self-directed investors and strategists, understanding this shift is crucial for navigating a market where price action is increasingly influenced by high-frequency machine consensus.
As investors look toward the near future, the intersection of advanced technology and market mechanics demands both intellectual curiosity and structural discipline While the proliferation of sophisticated algorithms and AI-driven liquidity will continue to amplify intraday volatility and sudden sector rotations, it also creates unprecedented opportunities for those who look beyond the algorithmic noise. By keeping a sharp focus on macroeconomic fundamentals, rigorous risk management, and fundamental price action, self-directed investors can navigate this evolving paradigm with confidence and clarity.
Thank you for reading. Until next week's close,
Have a safe and productive Trading week!
Fauzia Timberlake
About the Author: Fauzia Timberlake is a professional options coach and financial strategist specializing in risk management and portfolio architecture for self-directed investors. She is Founder and Managing Partner of Option Engines.
Questions / Comments
We're here to serve IVolatility users and we welcome your questions or feedback about the option strategies discussed in this newsletter. If there is something you would like us to consider and/or analyze, we're always open to your suggestions. Use support@ivolatility.com.
Previous issues are located under the Trade Ideas tab on our website.