IVolAI Study: IV/HV Ratio as a Stock Selection Signal — Does It Work?
A Cross-Sectional Study of 519 S&P 500 Stocks, 2021–2025
Summary
At IVolatility, we've built IVolAI — an AI-powered backtesting assistant designed to accelerate research and strategy development. It enables users to run backtests, explore ideas, and optimize strategies more efficiently. In this research series, we leverage IVolAI to test a range of hypotheses using our data & API and share the insights with you.
In Part I: Study, we found that the IVX30/HV20 ratio was the strongest predictor of individual stock underperformance. In Part II: Study, we showed that the IVX30 z-score is the best signal for timing SPY straddle entries (+61.24%, Sharpe 1.36), while IVP is a simpler but weaker alternative (+10.80%, Sharpe 0.46).
This Part III asks: does the IVX30/HV20 ratio — the popular metric on IVolatility's Stock Monitor screener — work as a cross-sectional stock selection signal? Can you sort stocks by IV/HV ratio, short the top names, and make money?
Key Findings:
- The ratio has no predictive power. Across 603,933 stock-day observations, the quintile spread is +0.19% (negligible). Spearman ρ = 0.006.
- Top-5 signal produces negative alpha. Stocks with the highest IV/HV ratio return +0.72% over 20 days vs. +1.01% for the universe average.
- 5-year backtest loses money. SHORT_OPTION on top-5 ratio stocks: -$129,532 on 547 trades (67% win rate but 3.6× loss asymmetry). SHORT_STOCK: -$139,540.
- The ratio flips sign year to year. Q5–Q1 spread was +2.40% in 2022 but -2.45% in 2025. No stable edge.
- Critical interaction with IVP: The "double extreme" (high ratio + high IVP) is the worst regime (-0.38% mean return, 48.2% win rate). Low ratio + high IVP is the best (+2.55%, 57.9% win rate). The ratio's only value is as a negative filter.
- Z-score remains the strongest signal across all three parts of this study.
Sections 10 and 11 tested IV-based signals on SPY — a single broad-market ETF. This section investigates whether the IVX30/HV20 ratio works as a cross-sectional stock selection signal: identifying individual stocks where implied volatility is most elevated relative to realized volatility, then trading them.
This is the ratio displayed on the IVolatility.com screener (Stock Monitor → IVX30/HV20 column). When the ratio is high (e.g., 2.0+), the market is pricing in roughly twice the volatility that the stock has actually experienced recently. The common intuition: this gap should close, either by IV falling (sell options) or by realized volatility catching up (stock moves).
What the Ratio Measures
- IVX30: 30-day implied volatility, calculated by IVolatility using a proprietary weighting of ATM options across expirations, normalized to a fixed 30-day tenor
- HV20: 20-day historical (realized) volatility, based on actual stock returns over the past 20 trading days
- Ratio = IVX30 / HV20: Values above 1.0 mean the options market expects more movement than the stock has delivered recently
The ratio is fundamentally different from the z-score (Section 10) and IVP (Section 11). Z-score measures how fast IV has changed relative to its own history. IVP measures where IV stands relative to its own range. The ratio measures the gap between implied and realized — a structural comparison, not a temporal one.
Data: 519 Stocks, 5 Years
We analyzed 519 S&P 500 constituents over the same study period (February 2021 – December 2025), computing daily forward returns at 1, 5, 10, 20, and 30 trading days. Total observations: 603,933 stock-days with non-null ratio values.
Distribution of IVX30/HV20 across all stock-days:
| Statistic | Value |
|---|---|
| Mean | 1.155 |
| Median | 1.116 |
| Std Dev | 0.358 |
| 5th percentile | 0.644 |
| 25th percentile | 0.917 |
| 75th percentile | 1.349 |
| 95th percentile | 1.793 |
The median of 1.12 means implied volatility is typically about 12% higher than realized — a structural premium reflecting the cost of insurance. Values above 1.6 (top 10%) represent stocks where the IV/HV gap is meaningfully wide.
Quintile Analysis: Ratio vs. Forward Returns
We sorted all 603,933 observations into quintiles by IVX30/HV20 and measured 20-day forward returns:
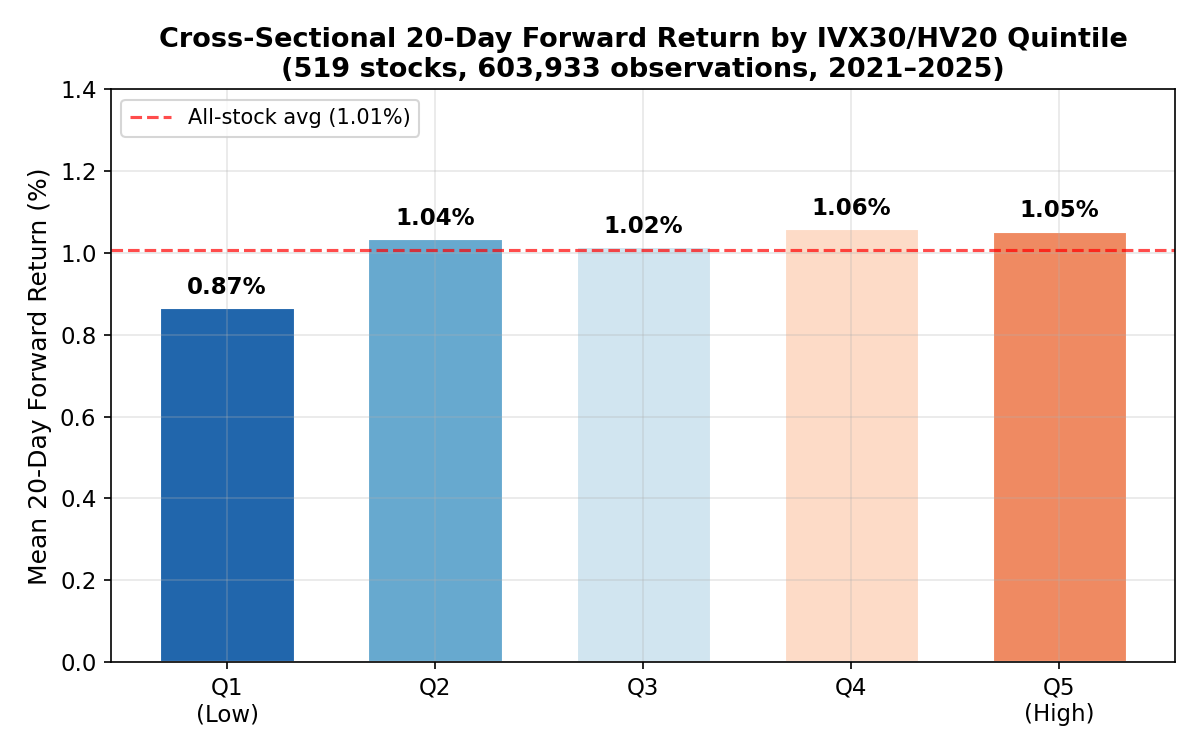
Figure C1: Mean 20-day forward return by IVX30/HV20 quintile across 519 stocks. The bars are nearly flat — no meaningful relationship between the ratio level and future returns.
| Quintile | Ratio Range | N | Mean 20d Return | Std Dev | Win Rate |
|---|---|---|---|---|---|
| Q1 (lowest) | 0.09 – 0.87 | 120,717 | +0.87% | 9.30% | — |
| Q2 | 0.87 – 1.04 | 120,717 | +1.04% | 8.94% | — |
| Q3 | 1.04 – 1.20 | 120,716 | +1.02% | 9.33% | — |
| Q4 | 1.20 – 1.42 | 120,716 | +1.06% | 9.49% | — |
| Q5 (highest) | 1.42 – 5.90 | 120,716 | +1.06% | 10.56% | — |
| Q5 – Q1 spread | +0.19% |
The quintile spread is +0.19% — economically negligible. There is no monotonic relationship between the ratio level and forward returns. Stocks with high IV/HV ratios do not underperform or outperform in a meaningful way. The only notable difference is that Q5 (highest ratio) has wider return dispersion (10.56% std vs 9.30% for Q1), reflecting the higher-volatility nature of these stocks.
Spearman rank correlation: ρ = +0.006 at the 20-day horizon (p < 0.001 due to N=603K, but economically zero). The statistical significance is purely an artifact of sample size.
Non-Overlapping Returns (Robustness)
Sampling every 20th observation to eliminate overlapping return bias:
| Quintile | N | Mean 20d Return | Std Dev |
|---|---|---|---|
| Q1 (lowest) | 6,036 | +0.72% | 9.46% |
| Q2 | 6,036 | +0.85% | 8.89% |
| Q3 | 6,036 | +0.88% | 8.84% |
| Q4 | 6,036 | +1.20% | 8.76% |
| Q5 (highest) | 6,035 | +1.23% | 10.52% |
With non-overlapping returns, Q5 actually shows the highest mean return (+1.23%) — the opposite of what a short-selling strategy needs. Stocks with the widest IV/HV gap slightly outperform, not underperform.
Annual Quintile Spread
| Year | Q1 Return | Q5 Return | Q5 – Q1 |
|---|---|---|---|
| 2021 | +0.62% | +1.18% | +0.56% |
| 2022 | -2.11% | +0.30% | +2.40% |
| 2023 | +3.01% | +1.46% | -1.55% |
| 2024 | -0.04% | +1.35% | +1.40% |
| 2025 | +3.02% | +0.58% | -2.45% |
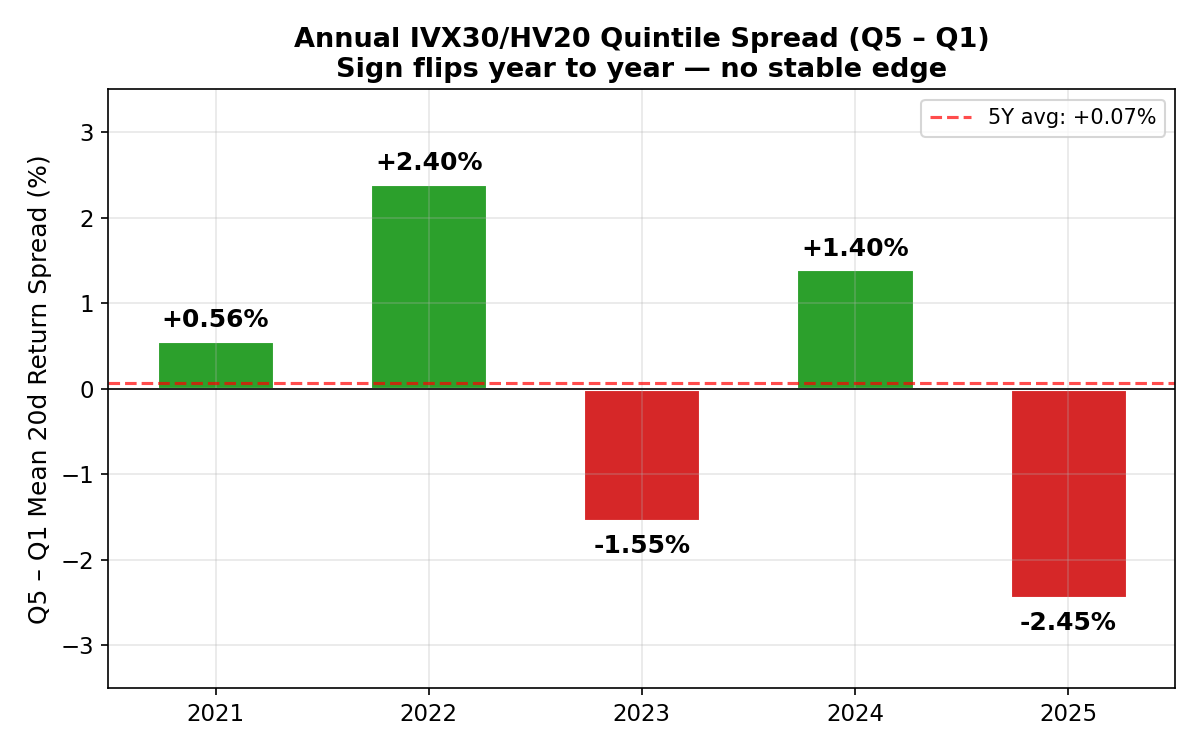
Figure C3: The Q5–Q1 return spread alternates between positive and negative each year, averaging near zero. No stable directional edge.
The spread flips sign year to year — positive in 2021-2022 and 2024, negative in 2023 and 2025. No stable directional edge. In 2022 (bear market), high-ratio stocks outperformed low-ratio stocks by +2.40%, suggesting the ratio captured some defensive quality. But in 2025, it reversed completely (-2.45%).
Top-5 Signal: Daily Stock Selection
Following the methodology of Part I: Study, we selected the 5 stocks with the highest IVX30/HV20 ratio each day and measured their 20-day forward returns. This mirrors the IVolatility screener approach: sort by IV/HV ratio descending, take the top names.
| Year | Signals | Mean 20d Return | Median | Std Dev | Win Rate |
|---|---|---|---|---|---|
| 2021 | 1,260 | +1.88% | +1.06% | 9.89% | 55.6% |
| 2022 | 1,255 | +0.83% | -0.02% | 9.91% | 49.8% |
| 2023 | 1,255 | +0.75% | +1.31% | 9.60% | 57.8% |
| 2024 | 1,245 | +0.66% | +0.81% | 12.47% | 54.3% |
| 2025 | 1,085 | -0.71% | -0.15% | 10.08% | 48.8% |
Top-5 vs. Universe average:
| Group | N | Mean 20d Return | Median | Std Dev | Win Rate |
|---|---|---|---|---|---|
| Top-5 (highest ratio) | 6,100 | +0.72% | +0.62% | 10.48% | 53.4% |
| Universe average | 605,992 | +1.01% | +0.78% | 9.55% | 54.2% |
The top-5 signal produces negative alpha: +0.72% vs +1.01% for the universe. These stocks underperform the average by -0.29% over 20 days, with higher volatility. A short strategy targeting these names would be betting against this underperformance — but the edge is too small and inconsistent to trade profitably.
5-Year Backtest: 8,818 Trades
We validated the statistical findings with a full backtest using the backtesting framework.
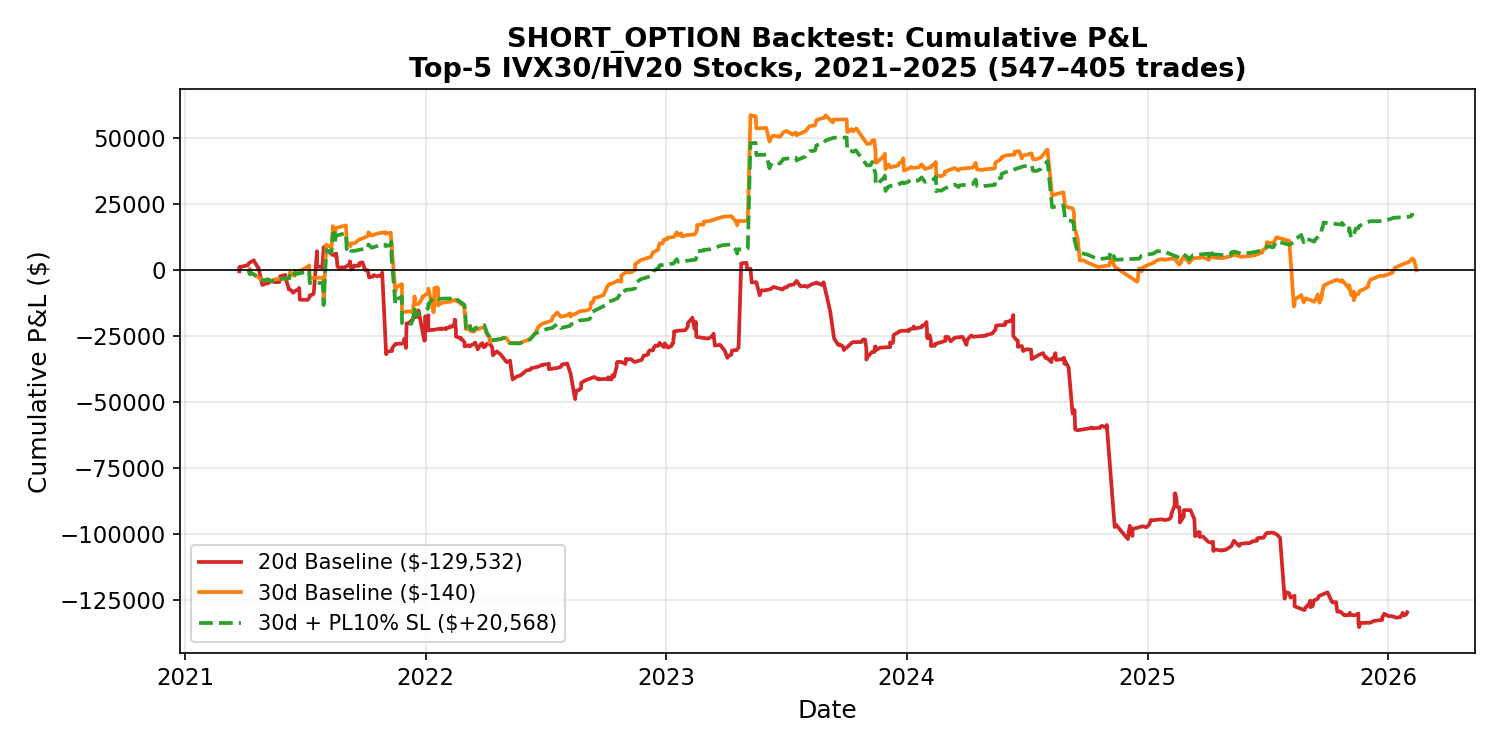
Figure C4: Cumulative P&L of the SHORT_OPTION strategy on top-5 IVX30/HV20 stocks. The 20-day baseline (red) loses -$130K with a catastrophic drawdown in 2024. Only the 30-day + SL combo (green dashed) ends marginally positive. For each top-5 signal, we opened two parallel positions: a short ATM straddle (SHORT_OPTION) and a short stock position (SHORT_STOCK). Holding periods of 20 and 30 days were tested with three stop-loss configurations.
| Strategy | Combo | Trades | Total P&L | Win Rate | Avg Return |
|---|---|---|---|---|---|
| SHORT_OPTION | 20d Baseline | 547 | -$129,532 | 67.1% | -23.8% |
| SHORT_OPTION | 30d Baseline | 405 | -$140 | 73.1% | -6.5% |
| SHORT_OPTION | 30d PL10% SL | 302 | +$20,568 | 71.2% | -11.6% |
| SHORT_STOCK | 20d Baseline | 1,122 | -$139,540 | 43.3% | -1.3% |
| SHORT_STOCK | 30d Baseline | 1,034 | -$154,310 | 46.0% | -1.5% |
Key observations:
-
SHORT_OPTION loses despite 67% win rate. The classic tail-risk profile of short options: many small wins overwhelmed by occasional large losses. The average winning trade returns +$320, but the average losing trade costs -$1,140 (3.6x asymmetry).
-
SHORT_STOCK is a net loser. Sub-50% win rate on shorts during a predominantly bullish 5-year window (2021–2025). The stocks selected by high IV/HV ratio are not systematically overpriced — they just have elevated implied volatility.
-
30-day holding slightly better than 20-day for options (-$140 vs -$130K), consistent with the theta decay benefit of longer holds. But still breakeven at best.
-
Stop-loss helps marginally for 30-day options (+$21K with PL10%), but cannot save the 20-day strategy.
Year-by-year (SHORT_OPTION, 20d Baseline):
| Year | Trades | P&L | Win Rate | Avg Return |
|---|---|---|---|---|
| 2021 | 105 | -$22,322 | 64.8% | -26.9% |
| 2022 | 131 | -$500 | 69.5% | -6.2% |
| 2023 | 104 | +$1,759 | 71.2% | -14.0% |
| 2024 | 97 | -$73,581 | 62.9% | -61.5% |
| 2025 | 110 | -$34,888 | 66.4% | -18.0% |
2024 was catastrophic (-$74K) — a strong bull market with low realized volatility but pockets of high IV drove the screener to select stocks that then rallied sharply. The short positions absorbed these rallies without the IV compression needed to offset them.
Why the IV/HV Ratio Fails as a Signal
The ratio does not predict forward returns because it conflates two distinct situations:
-
Structural premium stocks. Some stocks (biotech, meme, high-beta tech) consistently trade at high IV/HV ratios. This is a permanent feature, not a signal. The ratio reflects their options' structural demand, not a temporary dislocation.
-
Pre-event pricing. Before earnings, FDA decisions, or macro catalysts, IV spikes while HV (based on recent calm price action) stays low. The ratio jumps — but the high IV is correct, not excessive. When the event hits, realized vol catches up to implied.
-
No mean-reversion mechanism. Unlike the z-score (which measures deviation from a rolling mean and naturally reverts) or IVP (which captures extreme percentiles that regress), the IV/HV ratio has no inherent tendency to revert to a specific value. A stock can sustain a 2.0x ratio indefinitely.
Critical Finding: Ratio + IVP Interaction
The most important result from this analysis is the interaction between the IV/HV ratio and IVP:
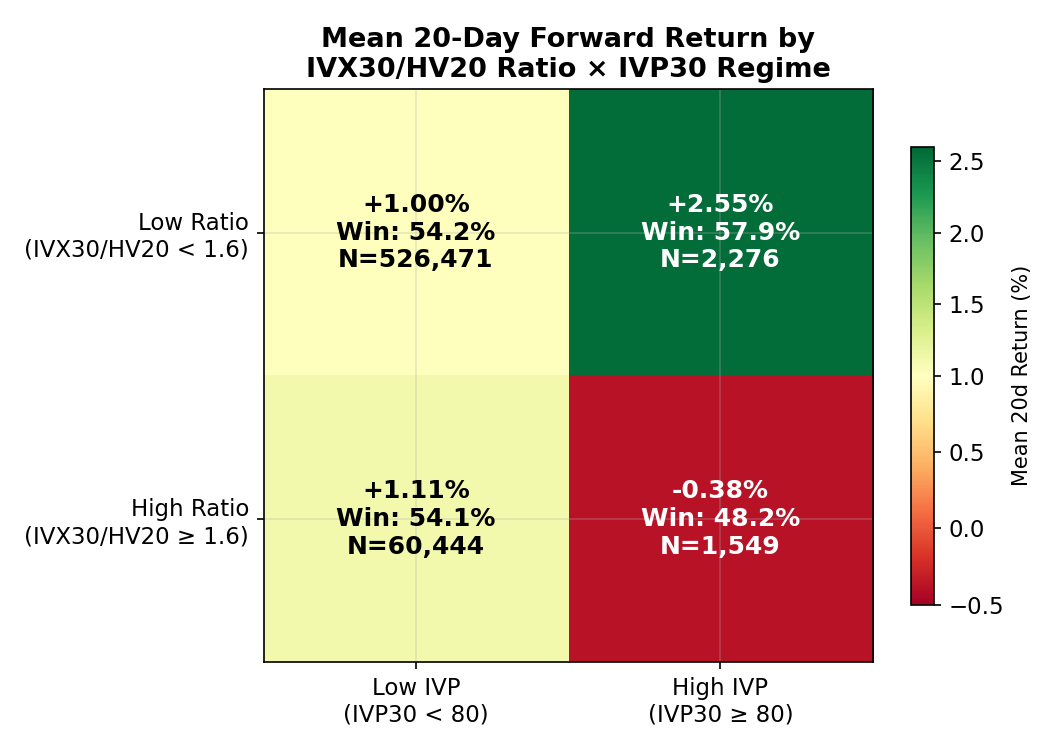
Figure C2: Mean 20-day forward return by IVX30/HV20 × IVP30 regime. The "double extreme" (high ratio + high IVP, bottom-right) is the worst-performing regime. Low ratio + high IVP (top-right) is the best.
| Regime | N | Mean 20d Return | Std Dev | Win Rate |
|---|---|---|---|---|
| Low Ratio + High IVP | 2,276 | +2.55% | 11.49% | 57.9% |
| High Ratio + Low IVP | 60,444 | +1.11% | 11.01% | 54.1% |
| Low Ratio + Low IVP | 526,471 | +1.00% | 9.38% | 54.2% |
| High Ratio + High IVP | 1,549 | -0.38% | 11.20% | 48.2% |
(High Ratio = IVX30/HV20 ≥ 1.6; High IVP = IVP30 ≥ 80)
The "double extreme" — high ratio AND high IVP — is the worst combination. These stocks return -0.38% over 20 days with only 48.2% win rate. When IV is both elevated vs. history (high IVP) and disconnected from realized vol (high ratio), the market is correctly pricing in an upcoming catalyst. These are precisely the stocks that should NOT be sold short.
Conversely, low ratio + high IVP is the best regime (+2.55%, 57.9% win rate). This captures stocks where IV is at its historical highs (IVP ≥ 80) but the ratio is low because HV has also risen — meaning realized vol has already caught up. The gap between implied and realized is small, yet IV remains elevated. This is where mean-reversion works: the realized volatility spike is fading, IV hasn't adjusted yet, and selling premium is profitable.
Comparison: Three IV Signals
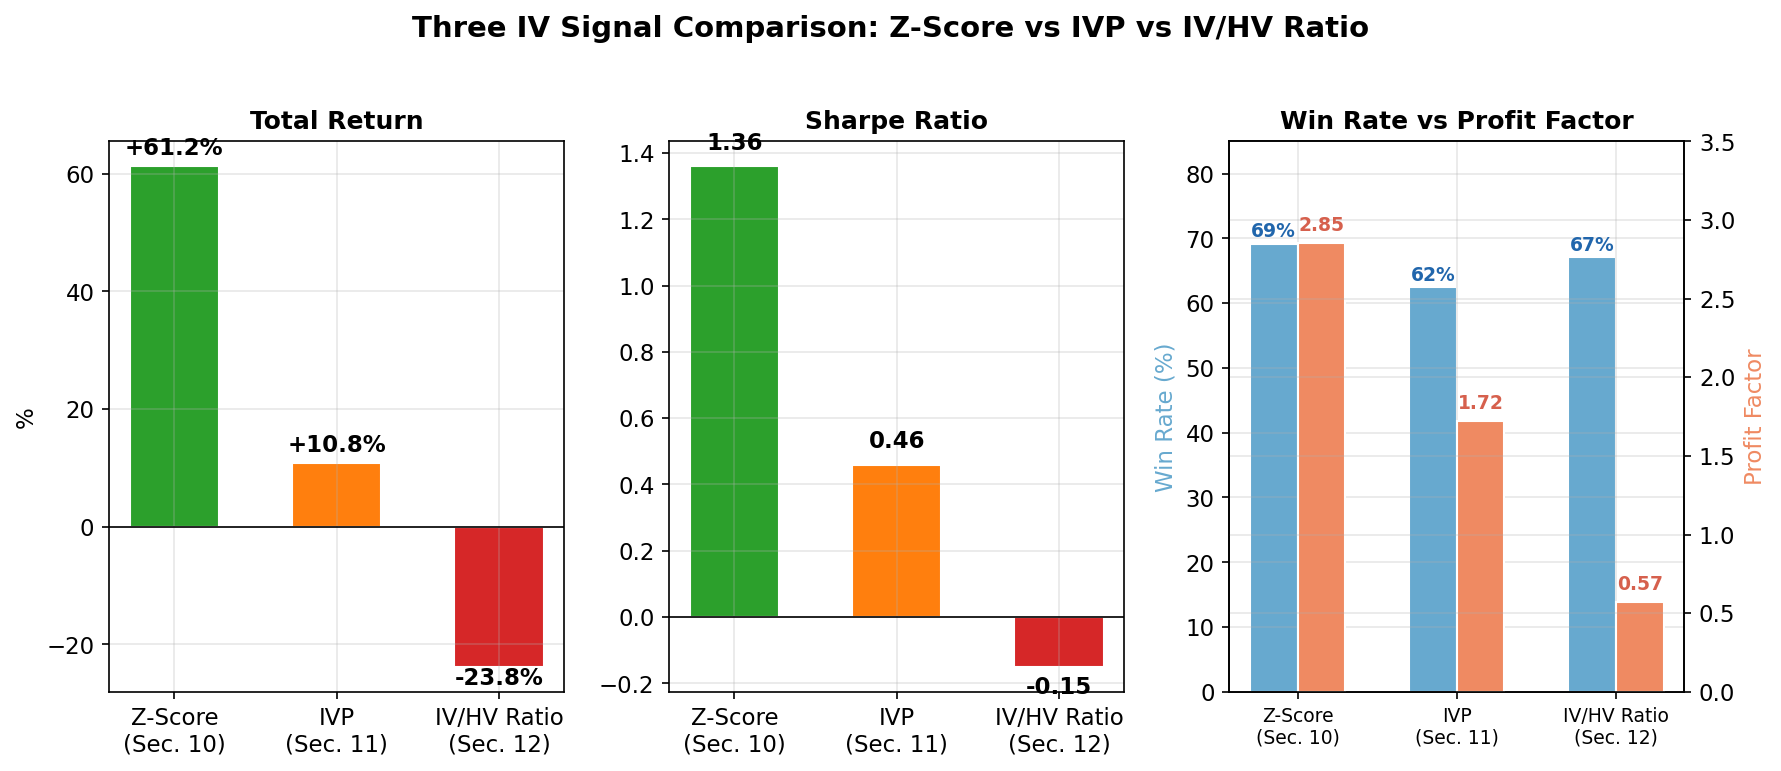
Figure C5: Head-to-head comparison of the three IV-based signals tested in this study. Z-score dominates on every metric. The IV/HV ratio has the highest win rate (67%) but the lowest profit factor (0.57) — many small wins destroyed by occasional large losses.
| Metric | Z-Score (Sec. 10) | IVP (Sec. 11) | IV/HV Ratio (this section) |
|---|---|---|---|
| Asset | SPY | SPY | 519 individual stocks |
| Signal Type | Rate of change | Level (percentile) | Structural gap |
| Mechanism | Sudden spike → reversion | Elevated level → normalization | Implied vs realized gap |
| 5Y Total Return | +61.24% | +10.80% | -$129K (loss) |
| Sharpe | 1.36 | 0.46 | Negative |
| Requires SL | No (hurts) | Yes (essential) | Cannot save |
| Key Strength | Precise timing | Simple to compute | Popular screener metric |
| Key Weakness | Requires z-score calc | Slow exit | No predictive power |
| Verdict | Best signal | Viable with SL | Not a tradeable signal |
Implications for Practitioners
-
Do not use the IV/HV ratio as a standalone trading signal. Sorting stocks by IVX30/HV20 and shorting the top names is a losing strategy over any meaningful timeframe.
-
The ratio is useful as a descriptive metric, not a predictive one. It tells you where the IV premium is widest, but not whether that premium is excessive. Think of it as a map, not a compass.
-
Combine with IVP for filtering. The conditional analysis reveals that the ratio adds value as a negative filter: avoid selling premium on stocks with high ratio + high IVP (the "double extreme"). This insight will inform the screener-driven backtest strategy in the next phase of this research.
-
The z-score remains the strongest signal. For IV-based trading on SPY, the IVX30 z-score (Section 10) is the clear winner. For cross-sectional stock selection, the ratio's only value is in identifying stocks to avoid when combined with IVP context.
Data and Reproducibility
This study uses data from the IVolatility.com API:
-
/equities/stock-market-datawithstockGroup=SP500_STOCKS— provides IVX30, HV20, IVX30/HV20 ratio, IVR30, IVP30 for 519 S&P 500 constituents. -
/equities/eod/stock-prices— stock prices for forward return computation.
Study parameters:
- Universe: 519 S&P 500 constituents (with sufficient data coverage)
- Date range: February 24, 2021 – December 31, 2025
- Observations: 603,933 stock-days
- Forward horizons: 1, 5, 10, 20, 30 trading days
- Statistical tests: Spearman rank correlation, quintile conditional analysis
- Robustness: Non-overlapping returns (every 20th observation), annual breakdown
- Backtest: 8,818 trades across 208 symbols, 6 parameter combinations, 2 strategies (SHORT_OPTION, SHORT_STOCK)
- DuckDB database:
iv_study_5y.duckdb(209 MB)
Disclaimer: This study is for informational and educational purposes only and does not constitute investment advice, a recommendation, or a solicitation to buy, sell, or hold any security, option, or financial instrument. Past performance and statistical findings do not guarantee future results. Options trading involves significant risk, including the potential for losses exceeding the initial investment. Always conduct your own due diligence and consult a qualified financial advisor before making any investment decisions.
Research and backtesting by IVOLAI. Analysis conducted using IVolatility.com data and API. IVX30 (30-day implied volatility) is calculated by IVolatility using a proprietary weighting technique factoring Delta and Vega of 8 ATM options per expiration, normalized to fixed tenors. HV20 (20-day historical volatility) is based on close-to-close stock returns.