Reactions and Overreactions
November 7, 2024
The Markets at a Glance


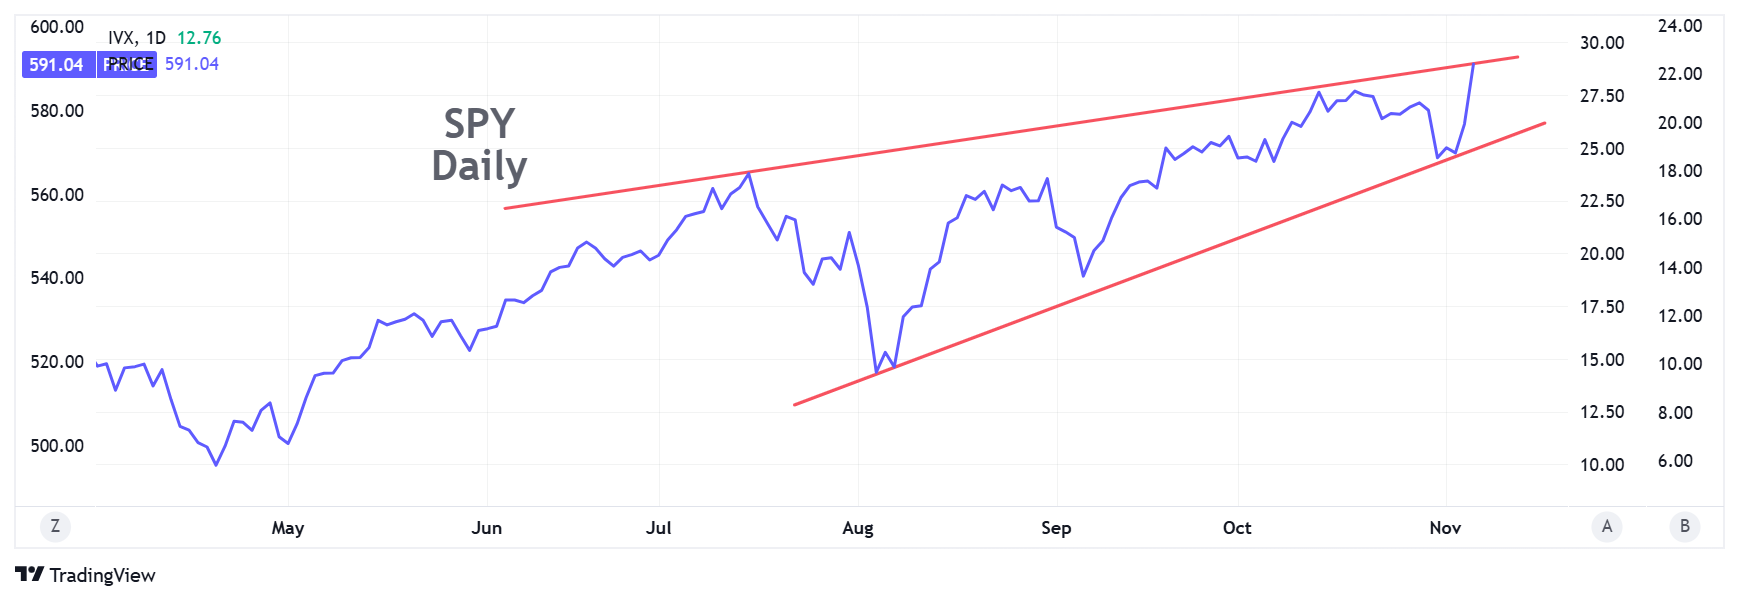
The days just prior to the election did finally unveil a volatility skew in the SPY as stocks remained relatively quiet while options began pricing in heightened implied volatility for the Wednesday, Thursday, and Friday SPY option expirations. It turned out the implied volatility was justified by the move in SPY that occurred today (Wednesday) – a whopping 2.5% move upward to new highs.
Then on Tuesday, an even larger volatility skew began to appear in certain stocks. (It likely appeared elsewhere as well, but I happen to follow the solar companies, so I noticed it there in particular.)
The implied volatilities on First Solar (FSLR) ATM calls were as follows on Tuesday's close with FSLR closing at 215.89:

This phenomenon apparently popped up somewhat quickly as people began to hedge or speculate over the last week on the possible movements in solar stocks under a Trump administration. (Trump favors oil companies and is negative on climate incentives.) Similar speculation occurred in the bitcoin markets and no doubt in other selected stock groups. What made the skew interesting was the fact that solar stocks rose all day Tuesday as the implied volatility was also rising. Generally, IV rises more with put buying as holders seek to protect against a fall in the stock price. But here the stock was moving up.
That's why you have to be careful about the conclusions you draw when you see stock price rising. On Wednesday morning after Trump was pronounced the winner, solar stocks collapsed, some as much as 25%. At the same time, however, so did the implied volatility.
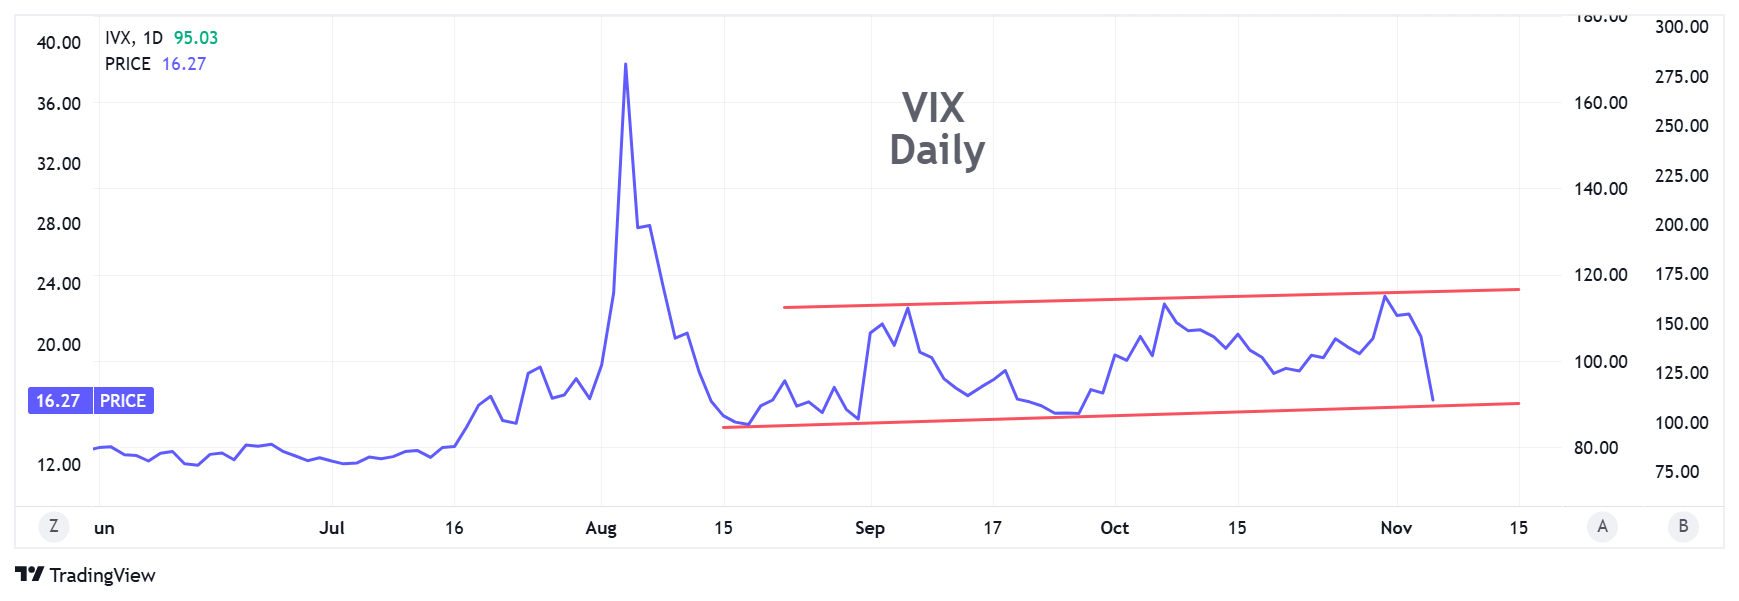
VIX dropped from 23 before the election to 16.4 on Wednesday. Options for Friday's ATM strike on FSLR (now the 192 strike based on Wednesday's close) are roughly .8 for this Friday and .6 for next Friday. That means the implied volatility effectively dropped by more than half today from yesterday on short-term options.
To be sure, the election was a big deal and there were plenty of reasons to fear contentious results. But even if there was violence or legal action as a result, neither of those events would have had a direct effect on corporate earnings and no immediate actions by either candidate will materially affect company fortunes until Trump takes office in January. The point is that stocks rise or fall on price anticipation and implied volatility rises and falls primarily on speculative fear and other emotions.
We also saw the emotional effect on the betting platforms where significant wagers were placed on the election result. One trader admitted placing $30 million in bets favoring Donald Trump to win. The point is that the rise in implied volatilities displayed by option prices is largely caused by emotion, and as such, they dissipate very quickly once the event occurs. For option traders, spiking implied volatilities therefore represent both caution signals and opportunities.
Strategy Talk: Overreactions – a Quick Take on Implied Volatility
We all know that option prices have two components: intrinsic value and extrinsic (or time) value. By definition, intrinsic value is determined by whether the option can theoretically be exercised for a profit at a given moment based on the price of the underlying relative to the strike price of the option. For calls where the stock price is below the option strike or puts where the stock price is above the strike (out-of-the-money options), there is zero intrinsic value and the entire price of the option is time value.
Time value, on the other hand, represents the additional value of an option resulting from the probability that the underlying will gain or lose intrinsic value in the time remaining before it expires. The "usual" or default expectation for how much a stock might move during an option's life is based on how much it has moved historically and the reference period is commonly the prior 100 trading days (though one could use any prior period one chooses).
Calculating historic volatility is therefore a straightforward calculation of the variance in day-to-day returns for some reference period – commonly the prior 100 trading days. It is annualized and expressed as either a decimal or a percent. Then, implied volatility shows up in any option as increased price due to increased time value.
When players expect a stock to have an outsized move, they bid up the price of options. Whether they expect an upward or downward move is irrelevant since option arbitrage keeps the prices of puts in concert with those of calls at the same strike and expiration.
Bidding up for options tends to raise their price (even without a directional move in the underlying stock). The new market price can then be placed back into the original pricing model to solve for a historic volatility number that would yield that market price. The resulting volatility is not the historic 100-day actual volatility but is instead seen as the volatility implied by the current market price of the option.
Implied volatility can increase or decrease as additional uncertainties present themselves in the market and players bid up (or down) the prices of options. Events such as earnings announcements generally cause a rise in the implied volatility of options expiring immediately afterward, since stocks often have outsized reactions to earnings announcements and market players expect that. After such events, option prices tend to return to their "natural" level of implied volatility – something closer to the historic level.
This creates a spike in implied volatility for the options expiration immediately following an earnings announcement or other event (like the election) but generally not for longer dated options.
Option players must pay attention to the implied volatilities of options they are trading to understand whether those options are under, over, or fairly priced. If overpriced (the more common scenario), they could represent an attractive writing opportunity. But that doesn't mean traders should short all overpriced options by any means.
The key is understanding why the options are priced where they are and in determining whether one agrees with the market price or not. Overpriced options frequently represent emotional overreactions by the market – but sometimes they are justified! As you can see from the post-election move in SPY, the volatility skew was justified and a short position in SPY call options could have easily lost money overnight.
In addition, traders must consider not only the implied volatility change after an event, but the directional change that will likely accompany it. Covered call writes or spreads will have a directional risk that could offset any gains from a reduction in implied volatility.
To determine whether option prices are overpriced or underpriced, one can compare the present option price in the market to the theoretically 'fair' price generated by the Black-Scholes or other acceptable model. You can also look at the implied volatility relative to the historic volatility. Since more distant option expirations generally price options near their theoretical values, you can look at the IV of a short-term option compared to that of a long duration to determine whether there is an implied volatility aberration.
In this manner, a trader can determine whether a certain strategy will be helped or hindered by an option price that is above or below the fair price. Also strategies can exploit an under or overvalued option. And then there are strategies that can specifically exploit a volatility skew.
The bottom line is that implied volatility provides a very good way of determining under or over-valued options or for identifying volatility skews to trade. But traders must remember several important facts about implied volatility:
- The "fair" price or historic IV of an option are never a given. They are at best good and consistent estimates.
- The options on some stocks adhere very closely to Black Scholes-calculated fair values, but for others, the options may trade consistently higher or lower. What you will find, however, is that for any individual stock, the options at all strikes and expirations are usually consistent because the same market maker or specialist is calculating all the quotes and using the same formula, implied volatility, etc.
- The use of a 100-day period to calculate historic volatility is arbitrary. The last 100 days may not be representative of a stock's true historic volatility.
- Volatility is not a constant. Stocks can exhibit wildly variable actual volatility over time, changing from quarter to quarter or year to year.
- The Black-Scholes model does not consider dividends. So if the IV on puts is greater than the IV of calls, it usually means there is a dividend coming.
Got a question or a comment?
We're here to serve IVolatility users and we welcome your questions or feedback about the option strategies discussed in this newsletter. If there is something you would like us to address, we're always open to your suggestions. Use rhlehman@ivolatility.com.
Previous issues are located under the News tab on our website.